2024
DSC 209R Project 2: Deceptive Visualization
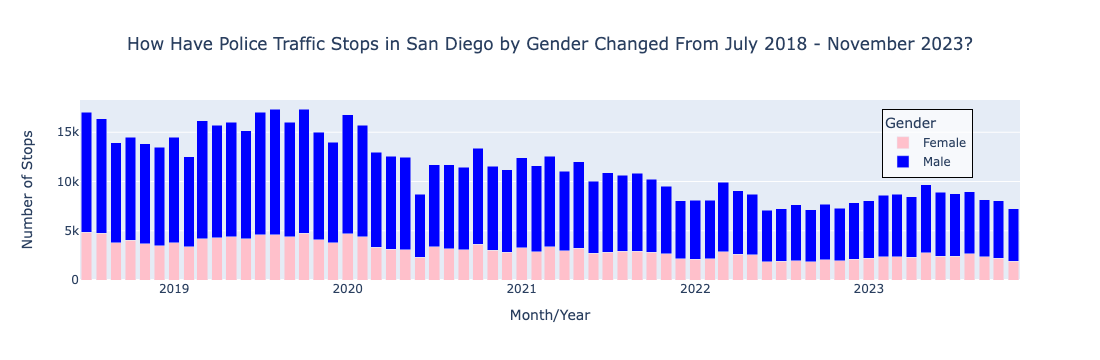
This was my second project for DSC209R. It involved creating an Earnest and Deceptive visualization. I chose to use traffic stop data for the city of San Diego.
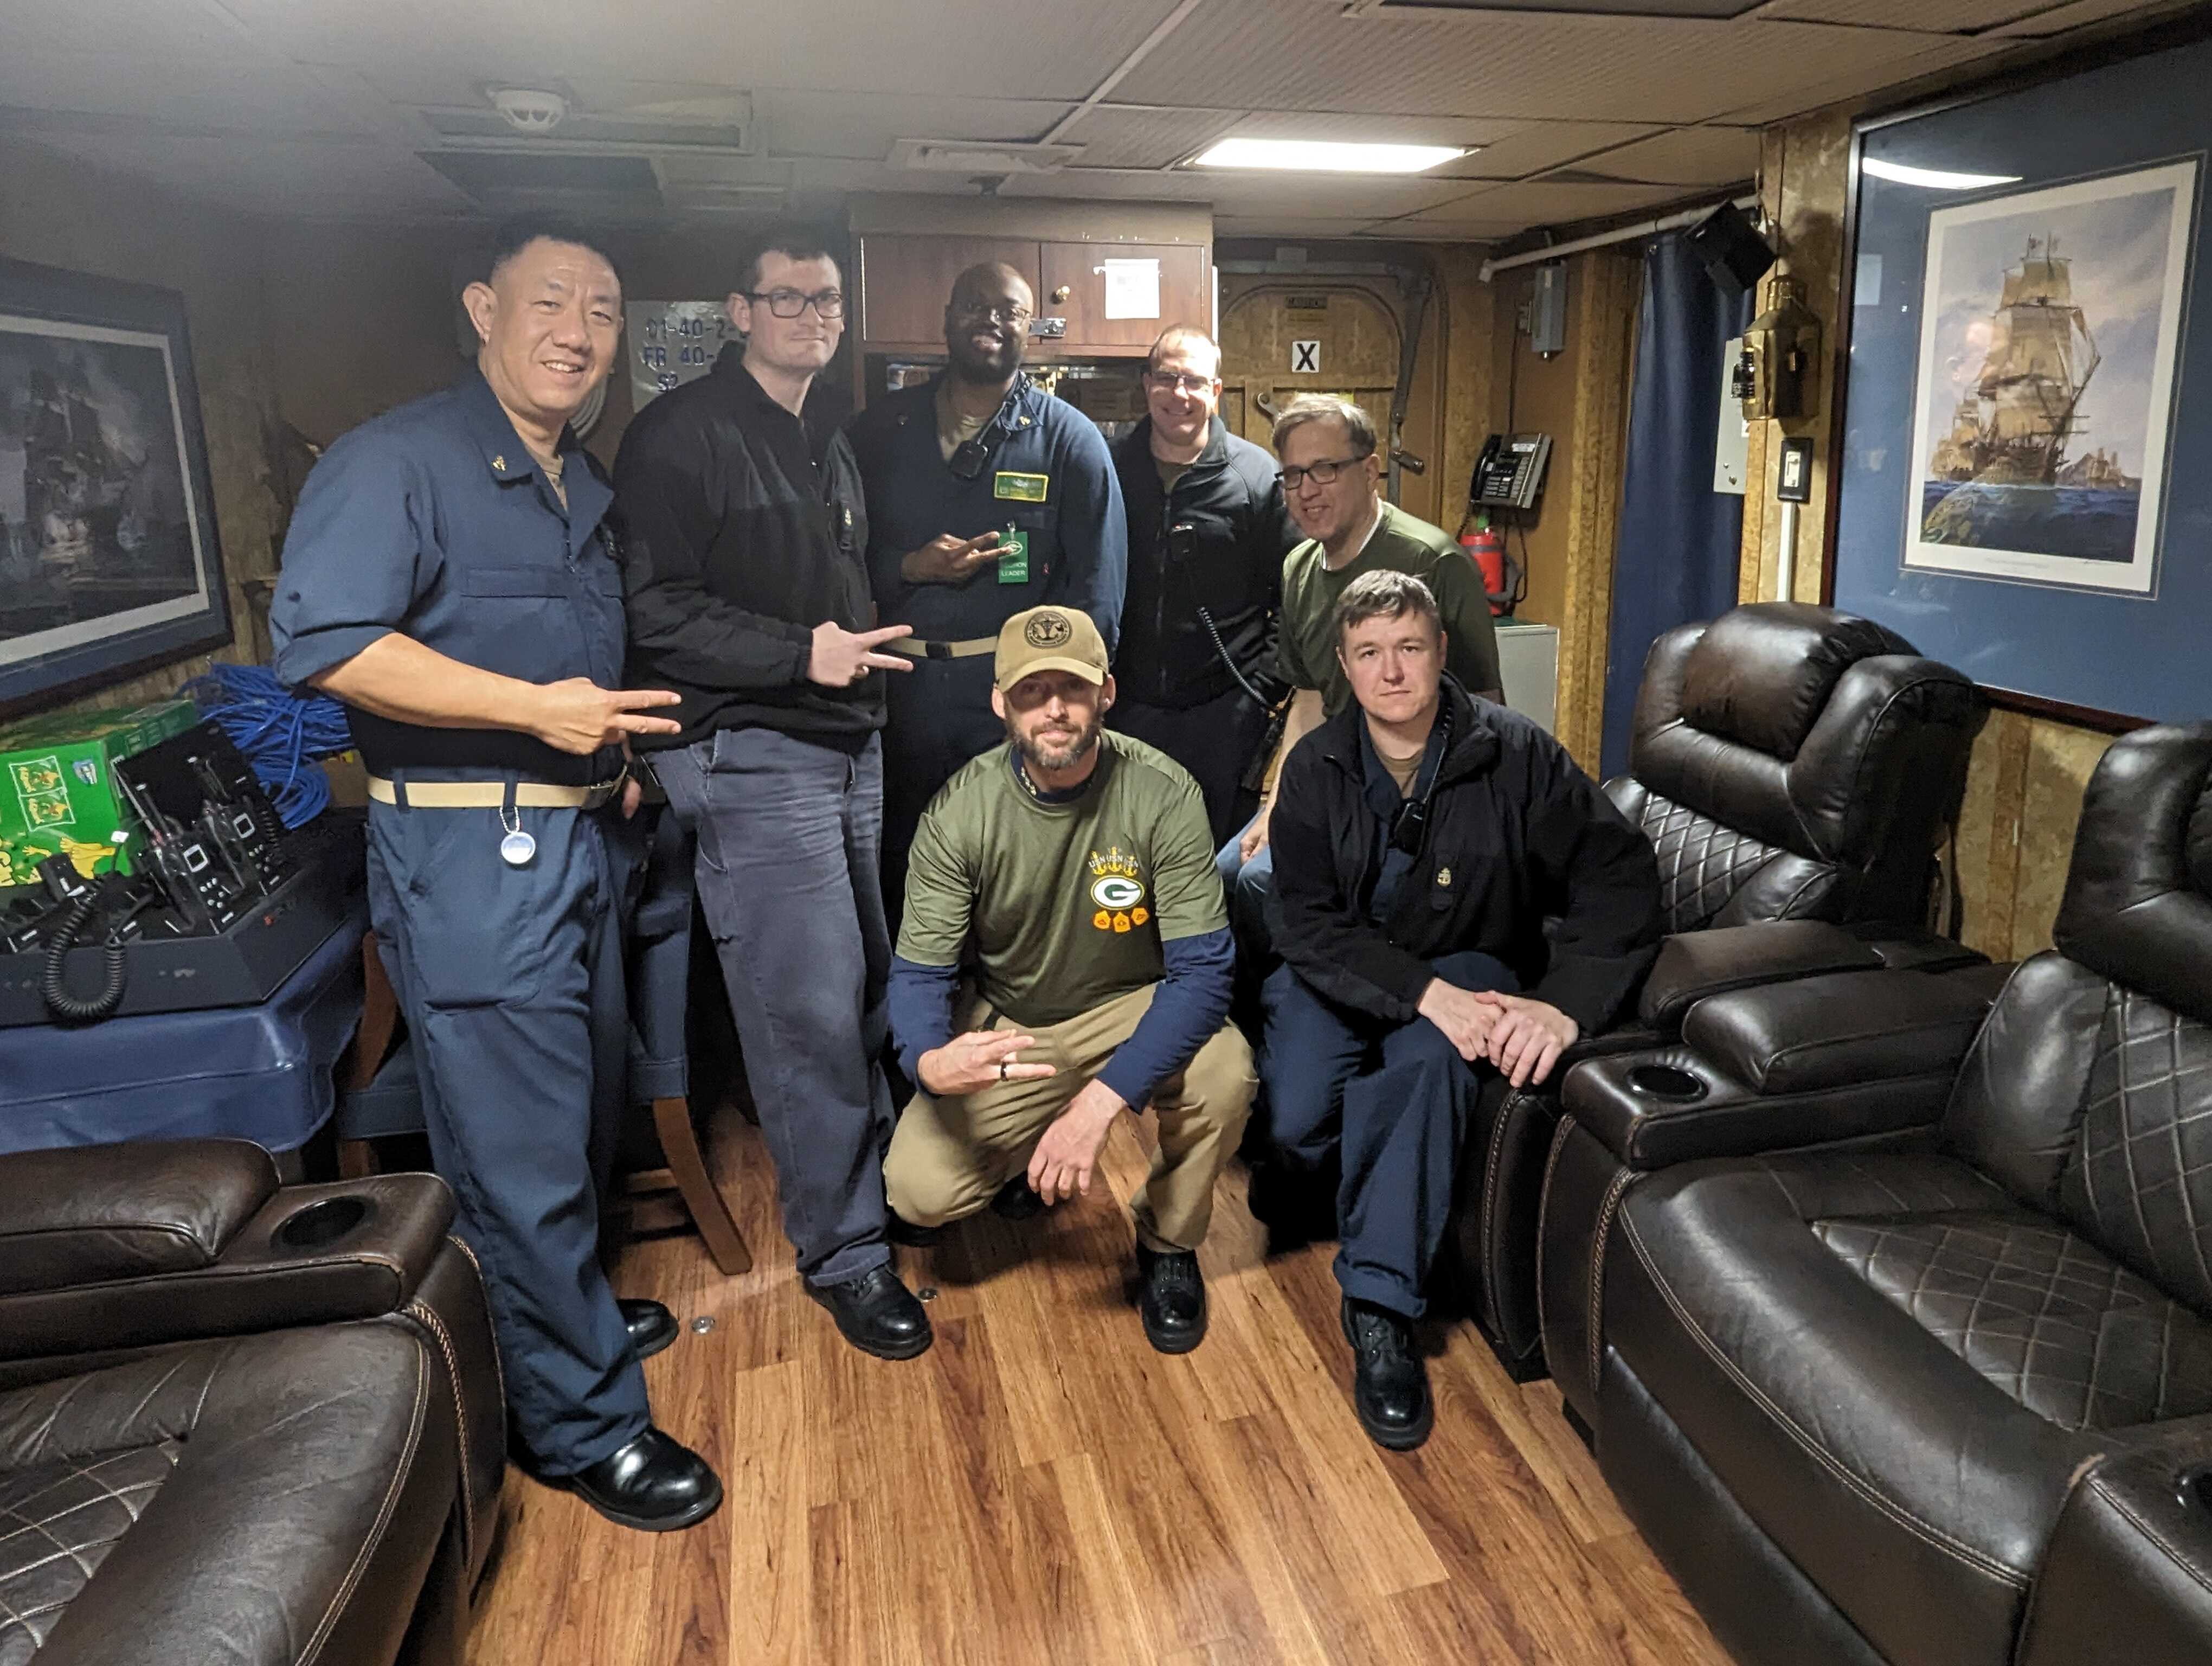
Hi, I'm Sean.
That's me in the green shirt (aboard the USS Green Bay in Sydney, Australia during Exercise Talisman Sabre 2023).
I'm part of Sleep, Tactical Efficiency, and Endurance Laboratory (STEEL) at Naval Health Research Center in Point Loma, CA.
I mainly work with active-duty Navy, measuring sleep in shipboard environments.
When I'm not working, I enjoy camping, ice hockey, music, sailing, and cooking (just to name a few things).
This was my second project for DSC209R. It involved creating an Earnest and Deceptive visualization. I chose to use traffic stop data for the city of San Diego.
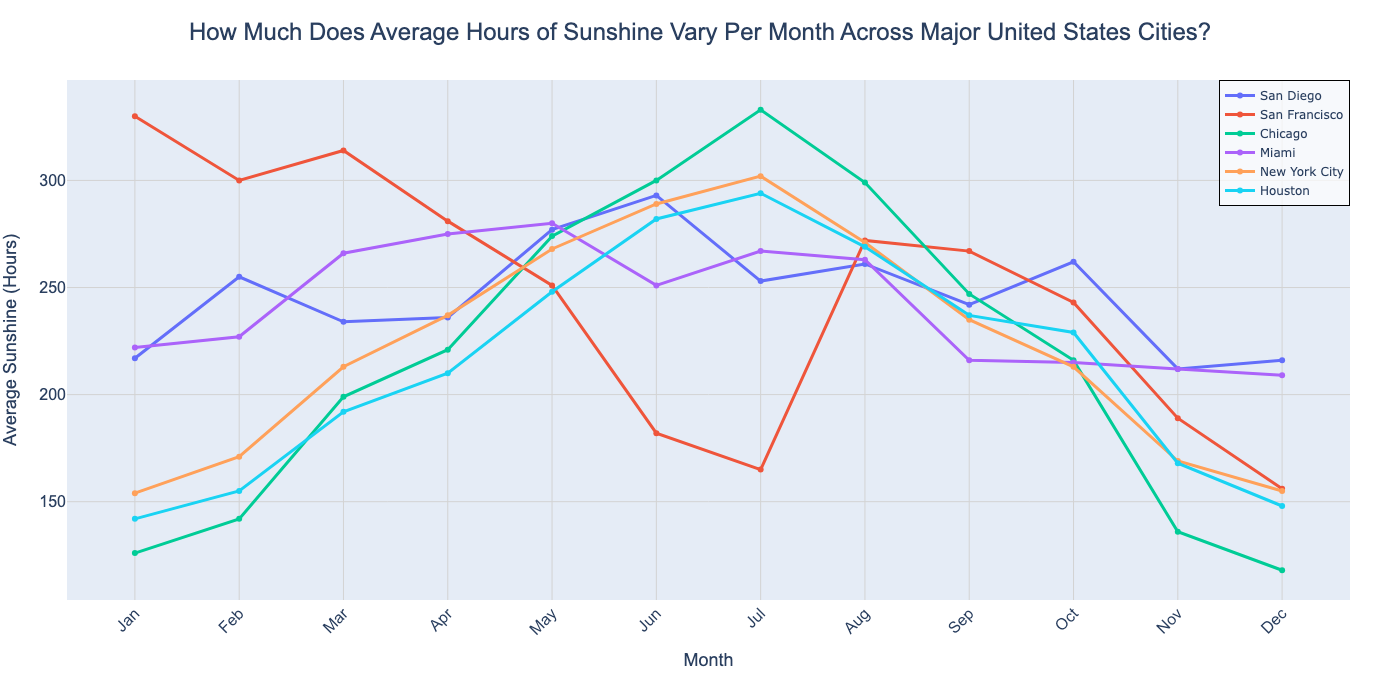
This was my first project for DSC 209R, which involved designing a single static visualization to effectively communicate an idea about climate data in major US Cities.
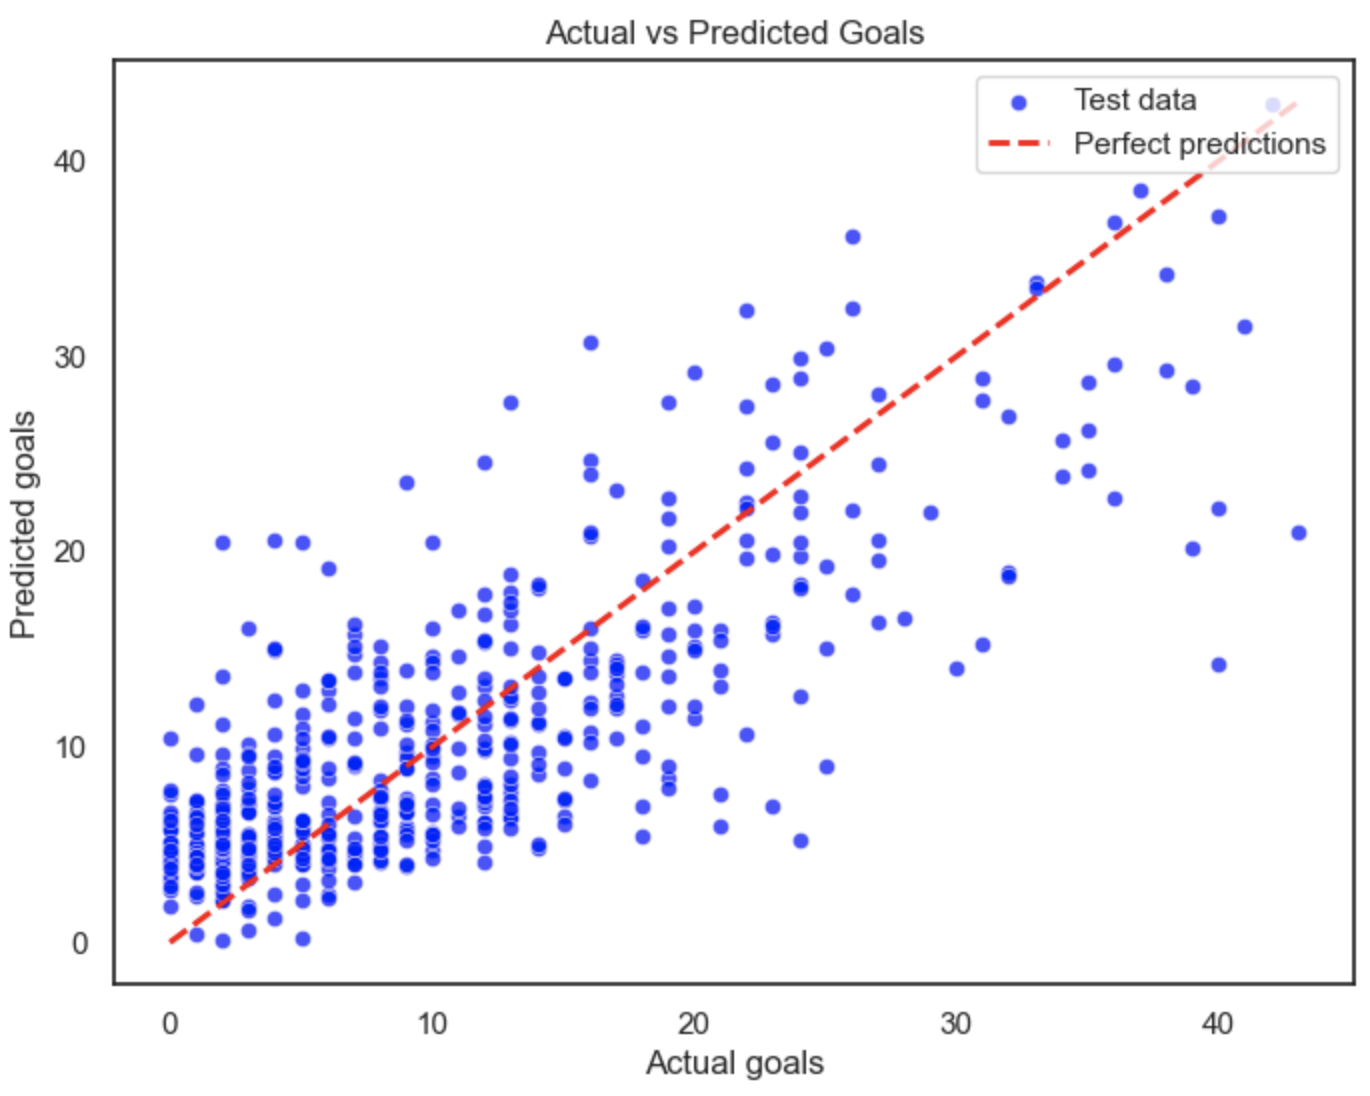
Research Questions: a) Can we identify features that are correlated with game outcome (win/loss) at the player or team level? b) Can we use an ML Regression model to predict goals scored in a season based on goals scored by players in their previous 2 seasons? and c) Can we use an ML Classification model to predict wins and losses?